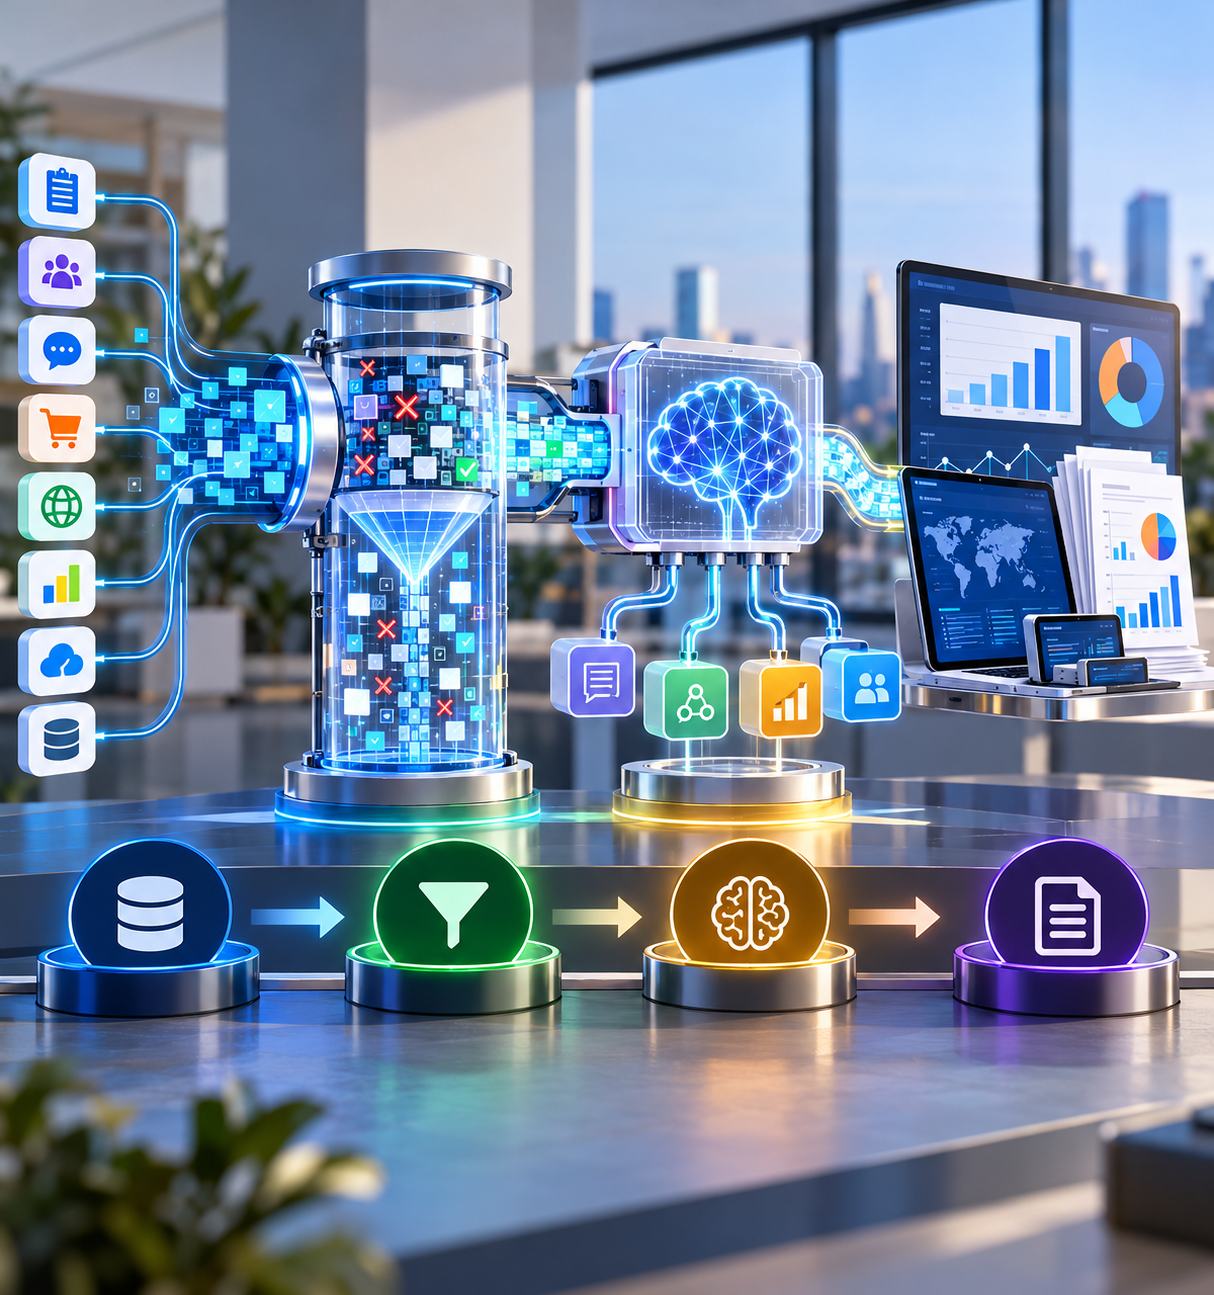
Hyperautomation links collection, cleaning, analysis, and reporting into one research pipeline. Learn the stack, the business case, and where it breaks.
Ask an insights team where its week goes, and the answer is often not "analysis." It goes to exporting survey files, matching them to CRM records, removing duplicate and fraudulent responses, rebuilding the same charts, and chasing approvals. Hyperautomation in market research is the practice of automating that whole chain, not one task at a time but as a connected pipeline from raw data to a decision-ready report.
This guide explains what hyperautomation is, how it maps onto a research workflow, where it breaks, and how to make the business case. It pairs with our guide to agentic AI in market research: agents supply the judgment layer, and hyperautomation supplies the pipeline they run on.
Key takeaways
- Hyperautomation combines several technologies to automate a full process, not a single step.
- Research operations suit it because much of the delay sits in handoffs between stages.
- The four stages to automate are collection, cleaning, analysis, and reporting.
- Automating a flawed process only produces flawed results faster, so fix the process first.
What Is Hyperautomation?
Hyperautomation is a disciplined approach to automating as many business processes as possible by combining tools such as robotic process automation (RPA), machine learning, and low-code platforms. Gartner, which placed it first among its top strategic technology trends for 2020, described it as "the combination of multiple machine learning (ML), packaged software and automation tools to deliver work."
Gartner's definition also covers the life cycle of automation, not just the tools: it applies "to all the steps of automation itself (discover, analyze, design, automate, measure, monitor and reassess)." That last part matters. Hyperautomation is a program you run and measure over time, not software you install once.
Hyperautomation vs. Automation vs. RPA vs. Intelligent Automation
| Term | What it means | Research example |
|---|---|---|
| Automation | Any task a machine does instead of a person | A scheduled survey reminder |
| RPA | Software bots that follow fixed rules across applications | A bot that downloads a data file and uploads it to a shared drive |
| Intelligent automation | RPA plus AI capabilities such as language processing | Coding open-ended answers into themes |
| Hyperautomation | Many tools, orchestrated to automate an end-to-end process | Collection, cleaning, analysis, and reporting in one pipeline |
IBM draws the core line clearly: "RPA is process-driven, whereas AI is data-driven." Hyperautomation uses both and adds the orchestration that connects them.
The Component Stack
A working hyperautomation stack usually draws on six kinds of technology: RPA for rule-based steps, machine learning for prediction and classification, natural language processing for text, process mining to find where time is lost, orchestration to sequence the steps, and low-code tools so analysts can change workflows without waiting for engineers. Gartner's 2021 definition names several of these directly: "robotic process automation (RPA), low-code application platforms (LCAP), artificial intelligence (AI) and virtual assistants."
Why Research Operations Is a Strong Target
The Hidden Cost of Manual Research Operations
Manual research operations hide their costs in small pieces. No single file export takes long, and no single deduplication pass feels expensive. Added up across every wave of a tracking study, those pieces become days of skilled time spent on work that does not require a researcher's judgment. They also introduce errors, because every manual handoff is a chance to load the wrong file or apply last quarter's weights.
Cost per Insight: The Metric That Matters
We recommend measuring hyperautomation with one number: cost per insight. Divide the total cost of producing research (people, tools, sample, and overhead) by the number of decision-ready findings delivered to stakeholders in the same period. Cost per study rewards cheap studies that nobody uses. Cost per insight rewards the whole system for producing findings that reach a decision.
The Four-Stage Automated Research Pipeline
The pipeline below follows the four stages Merkmetryx uses on its own platform, which its product page labels Ingest, Clean, Analyse, and Deliver.
Stage 1: Collection and Integration
The pipeline pulls data from every source the study needs: survey panels, social channels, commerce platforms, web analytics, and CRM systems. The aim is one connected dataset rather than a folder of exports. Merkmetryx lists more than 500 data sources and integrations, including social platforms, commerce sites such as Amazon and Shopify, and analytics and CRM tools such as Google Analytics, Salesforce, and HubSpot.
Stage 2: Cleaning, Deduplication, and Normalization
This is where automation earns the most trust, or loses it. The pipeline removes duplicates, standardizes formats, and screens out fraudulent or careless responses. Simple checks are not enough. In a 2020 study, Pew Research Center found that widely used opt-in online sources contained "about 4% to 7%" bogus respondents and that 84 percent of those bogus respondents passed a standard attention-check question. Layered detection that looks at patterns across a whole response should be a baseline requirement. Merkmetryx reports a 99.8 percent bot rejection rate for its platform.
Stage 3: NLP and Machine Learning Extraction
Clean data then moves through models that classify sentiment, code open-ended answers into themes, segment respondents, and flag unusual movements in key metrics. Language coverage matters for multicountry work; Merkmetryx states support for more than 40 languages.
Stage 4: Visualization and Reporting
The last stage turns results into dashboards and reports that update as new data arrives. In one Merkmetryx case study, a consumer electronics brand that moved from spreadsheet-based reporting to automated dashboards saw a 60 percent reduction in time to insight.
When Zero Human Touches Is the Right Goal
Straight-through processing, where data moves from source to report with no manual step, is the right target for mechanical work: loading files, applying agreed cleaning rules, recalculating weights, and refreshing dashboards. A person adds nothing to these steps except delay and the risk of a typo.
It is the wrong target for judgment calls. Deciding what to research, whether a sample is fit for purpose, and what a finding means for the business should stay with people. A useful rule is to automate the processing and keep humans on the decisions.
Where Hyperautomation Breaks
- Automating a broken process. If your questionnaire review is unclear about who approves what, automation only makes the confusion run faster. Map and fix the process first; that is what Gartner's "discover, analyze, design" steps are for.
- Data quality debt. Inconsistent product codes, duplicate customer records, and undocumented variable names do not disappear when you automate. They flow into every report.
- Fraud at scale. A pipeline that fields more surveys can also admit more bad respondents. Pew found that bogus respondents "tend to select positive answer choices," which can inflate purchase intent and satisfaction scores.
- Lost intuition. When researchers never see raw data, they can stop noticing what looks odd. Schedule regular reviews of raw responses, even in a fully automated pipeline.
A Hyperautomation Maturity Model for Insights Teams
| Level | Name | What it looks like |
|---|---|---|
| 0 | Manual | Every step is done by hand in spreadsheets and slides |
| 1 | Task automation | Individual tasks are automated, such as scheduled exports or survey reminders |
| 2 | Connected stages | Two or more stages pass data automatically, such as collection feeding cleaning |
| 3 | End-to-end pipeline | Data moves from source to dashboard without manual steps; people review results |
| 4 | Adaptive pipeline | The pipeline monitors itself, flags anomalies, and adjusts with human approval |
The move from level 1 to level 3 is where handoffs disappear, which makes it the natural place to start investing.
Building the Business Case
Start with a baseline. Measure, for three recent studies, the elapsed days from brief to report, the hours of skilled time spent on mechanical work, and the number of errors found after delivery. Then estimate the same figures under an automated pipeline, using vendor references and a pilot study rather than brochure claims. The case usually rests on three gains: shorter cycle time, skilled hours moved from processing to analysis, and fewer post-delivery corrections. We compared those trade-offs in more detail in Survey Automation vs. Manual Research.
Frequently Asked Questions
What is hyperautomation in market research?
It is the coordinated use of RPA, machine learning, natural language processing, and orchestration to automate the research pipeline from data collection through cleaning, analysis, and reporting, with people focused on design and interpretation.
Is hyperautomation the same as RPA?
No. RPA automates rule-based tasks inside a process. Hyperautomation combines RPA with AI and other tools to automate whole processes and includes the work of finding, measuring, and improving those processes over time.
Does hyperautomation remove the need for researchers?
No. It removes mechanical work such as file handling, cleaning, and chart building. Researchers still define questions, judge sample quality, and explain what findings mean.
What should we automate first?
Start with the stage where work waits longest. Data cleaning and reporting are strong candidates, because both repeat with every wave of a study and follow rules that can be written down.
To see the four-stage pipeline in action, explore the Merkmetryx platform.